
Best Texas Scratch Off Tickets: Odds, Remaining Prizes & More
Find the best scratch-off tickets to buy in Texas right now. We rank all 72 active Texas Lottery scratch-off games by ROI, odds, and remaining prizes — updated daily from official sources. Use the tabs below to filter by best value, best odds, newest releases, or games to avoid.
Best picks by budget
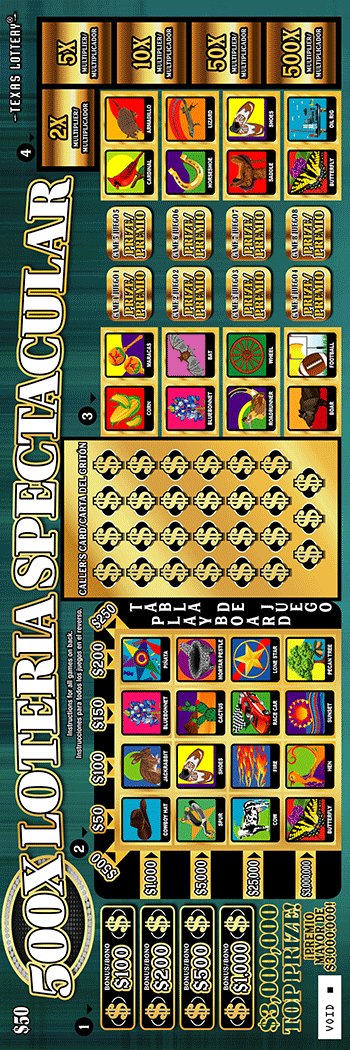
Highest overall grade
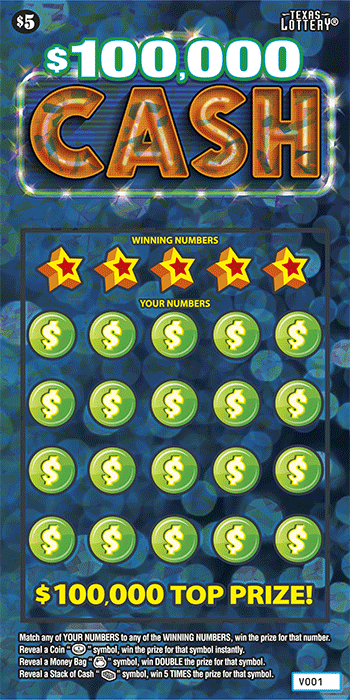
Highest overall grade among $5 tickets

Highest overall grade among $20 tickets
All games
Sorted by Best Grade




































How We Calculate Value, ROI & Grades
Every game on this page shows the same four figures and a letter grade. Here’s what each one means.
- Top prize — the game’s largest advertised prize, as published by the Texas Lottery.
- Top prizes unclaimed — how many of those the Texas Lottery has not yet recorded as claimed. An unclaimed prize may already be sitting on a ticket someone has bought, so this doesn’t guarantee one is still on a shelf.
- Published odds — the Texas Lottery’s original “1 in X” chance of winning any prize, which includes winning back just the ticket price. These are the odds set when the game was printed, not a recalculation of the odds among unsold tickets.
- Est. ROI — the estimated average gain or loss against what you spend. −20% means roughly 80¢ back per $1. We work it out from the prize counts the lottery reports and an estimate of how many tickets remain, so it’s a model rather than a measurement, and any single ticket can land far from the average.
- Grade — our 0–100 score shown as a letter, A being 85 or above. The largest single factor is whether a game still has unclaimed top prizes. Among the games that do, the grade is driven mostly by estimated return and by how the top-prize odds have moved since launch.
We read official Texas Lottery prize reports daily. ROI and grades are our own calculations, not official lottery ratings. Read our full methodology for how we source data, estimate remaining tickets, and calculate expected value, ROI and the Texas game grades.
Prize Activity Summary
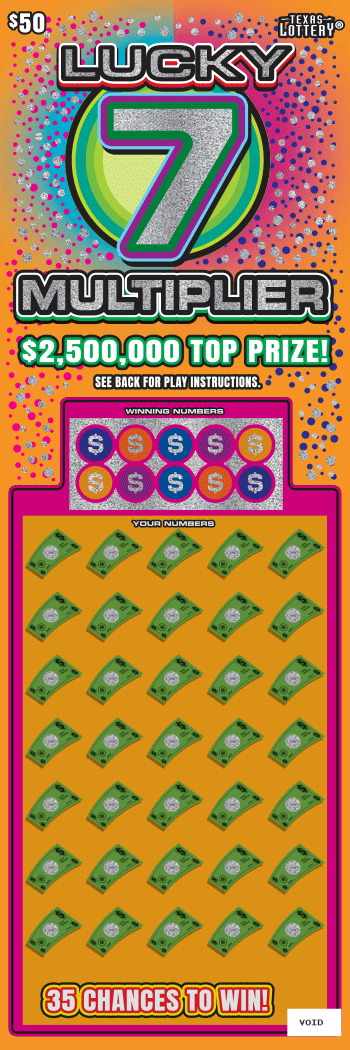
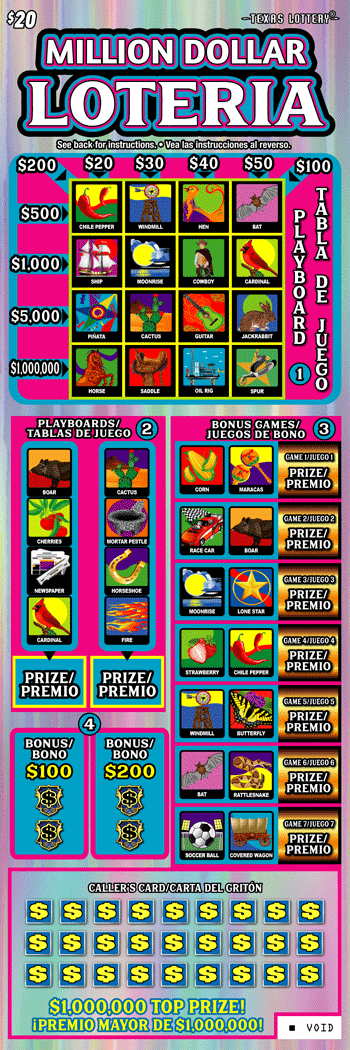
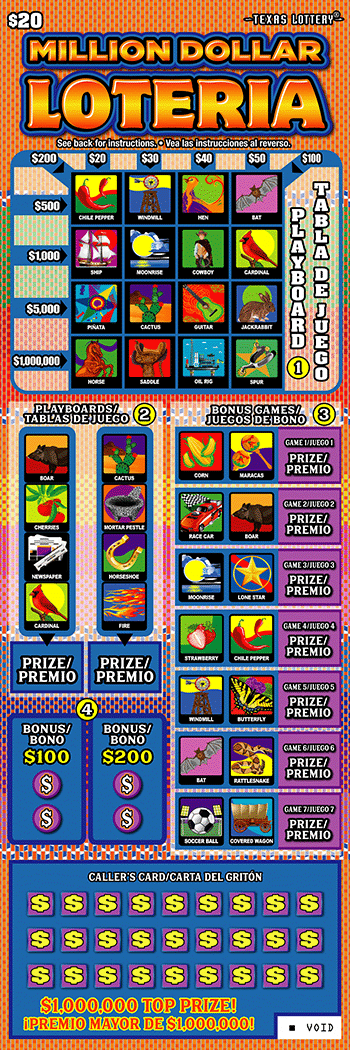
Over the past 31 days, scratch-off games in this state paid out approximately $319.3 million in prizes, averaging $10.3 million per day across 70 active games. The overall prize pool decreased by 0.4% during this period, with 418,395 individual prizes claimed across all tiers. Million Dollar Loteria leads in prize activity with $27.1 million claimed ($20 ticket). 2 top prizes remain. 500X Loteria Spectacular follows with $18.9 million in claims, with only 2 top prizes remaining.
Cheaper combinations that beat a single ticket
For some Texas tickets, spending the same money on two or more cheaper tickets gives a higher total expected value. These are the ones where that is currently true.
Instead of
Cowboys
$5
Buy instead
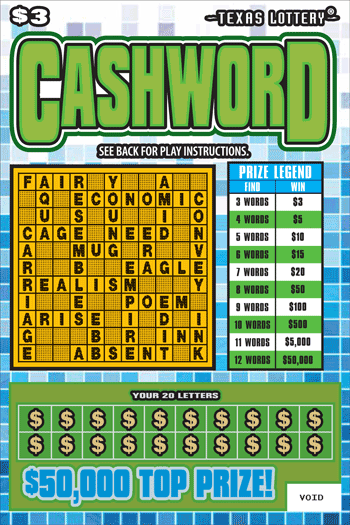
1× Cashword $3 + 1× Patriotic Payout $2
Both cost $5, but the pair carries about +8.2% more expected value than the single ticket.
$2 1 of 8 have a cheaper combination worth more +5.8% avg
-
 Instead of
20X The Money
#2646
Buy instead
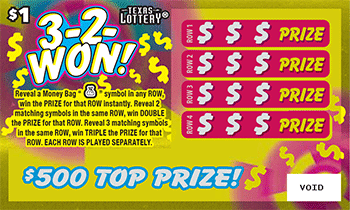
2× 3-2-Won! $1
+5.8%
Instead of
20X The Money
#2646
Buy instead
2× 3-2-Won! $1
+5.8%
$5 5 of 20 have a cheaper combination worth more +4.2% avg
-
Instead of
Cowboys
#2754
Buy instead
1× Cashword $3 + 1× Patriotic Payout $2
+8.2%
-
Instead of
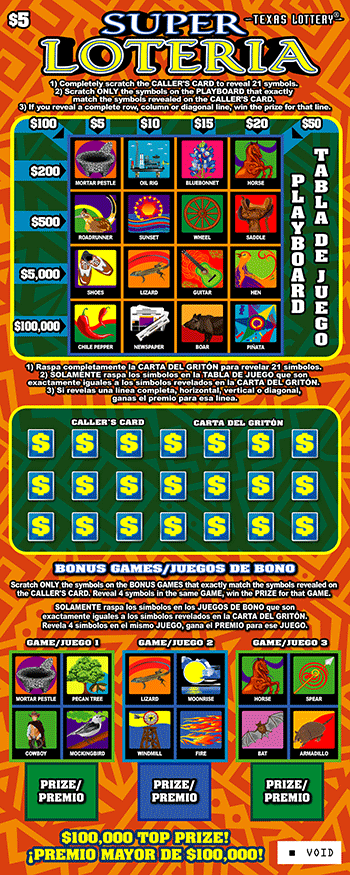
Super Loteria
#2648
Buy instead
1× Cashword $3 + 1× Patriotic Payout $2
+5.7%
-
Instead of
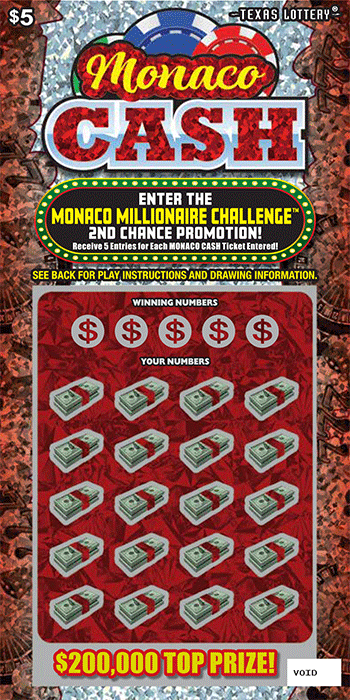
Monaco Cash
#2736
Buy instead
1× Cashword $3 + 1× Patriotic Payout $2
+4.5%
-
Instead of
Houston Texans
#2755
Buy instead
1× Cashword $3 + 1× Patriotic Payout $2
+2.0%
-
Instead of
Ms.PAC-MAN
#2747
Buy instead
1× Cashword $3 + 1× Patriotic Payout $2
+0.7%
$10 5 of 12 have a cheaper combination worth more +1.4% avg
-
Instead of
Monaco VIP
#2737
Buy instead
2× $100,000 Cash $5
+3.6%
-
Instead of
100X The Cash
#2713
Buy instead
2× $100,000 Cash $5
+1.3%
-
Instead of
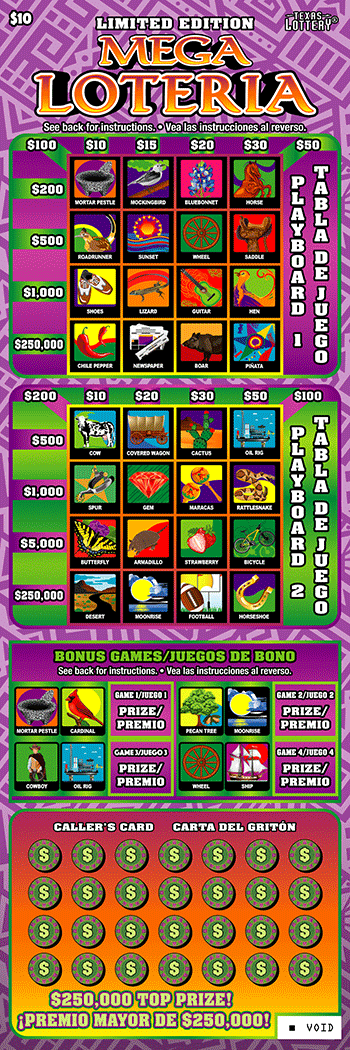
Mega Loteria
#2669
Buy instead
2× $100,000 Cash $5
+0.9%
-
Instead of
Limited Edition Mega Loteria
#2676
Buy instead
2× $100,000 Cash $5
+0.8%
-
Instead of
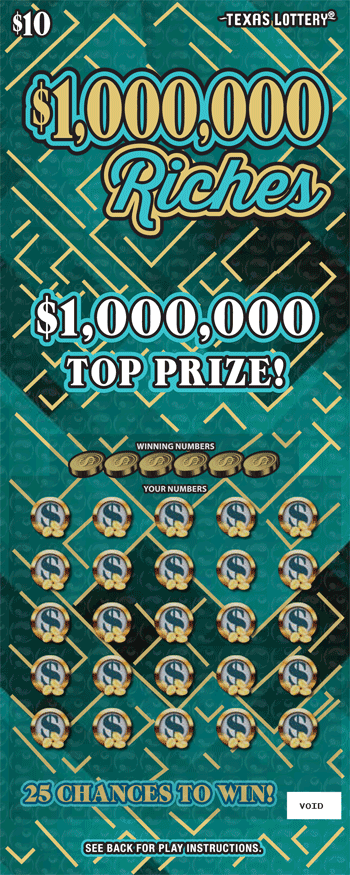
$1,000,000 Riches
#2636
Buy instead
2× $100,000 Cash $5
+0.1%
$20 1 of 16 have a cheaper combination worth more +2.5% avg
-
Instead of
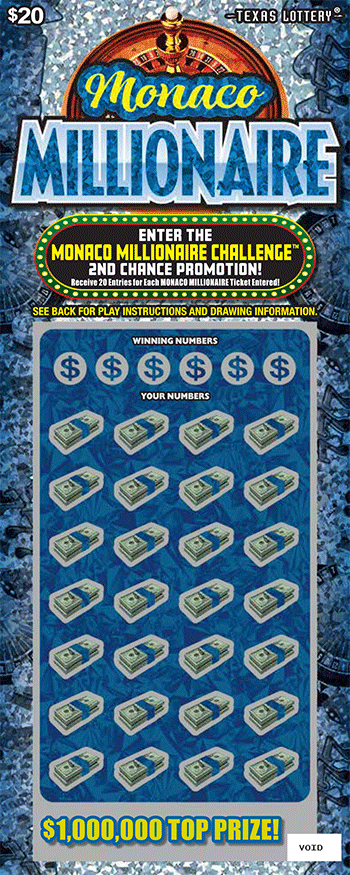
Monaco Millionaire
#2738
Buy instead
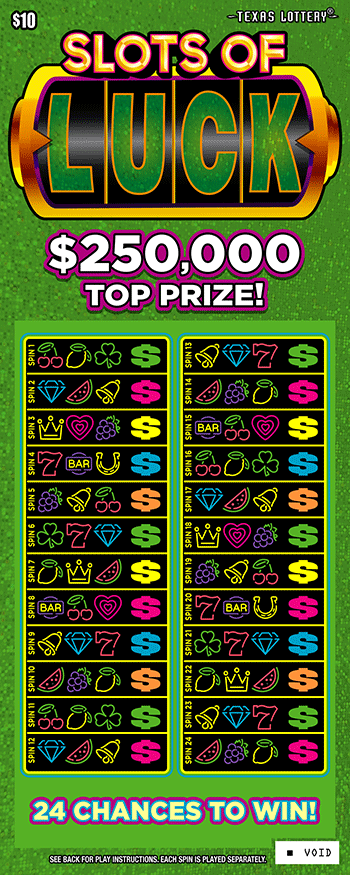
2× Slots of Luck $10
+2.5%
$30 1 of 2 have a cheaper combination worth more +0.1% avg
-
Instead of
Millionaire's Club
#2730
Buy instead
1× Million Dollar Loteria $20 + 1× Slots of Luck $10
+0.1%
$100 4 of 4 have a cheaper combination worth more +2.2% avg
-
Instead of
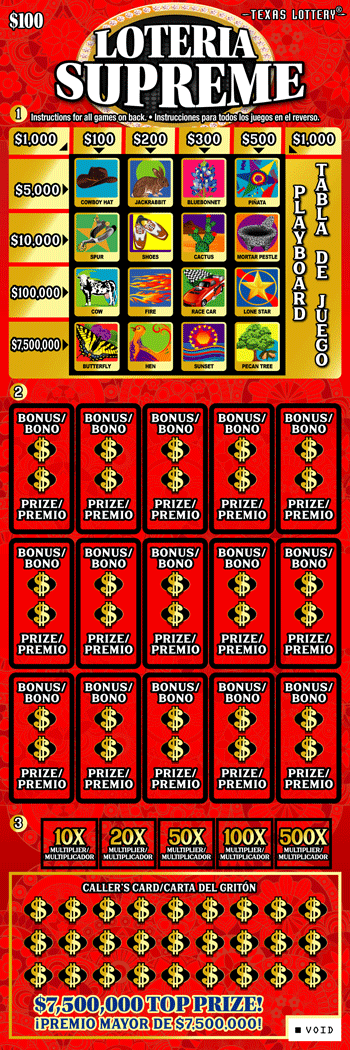
Loteria Supreme
#2587
Buy instead
2× $5 Million Royale $50
+2.7%
-
Instead of
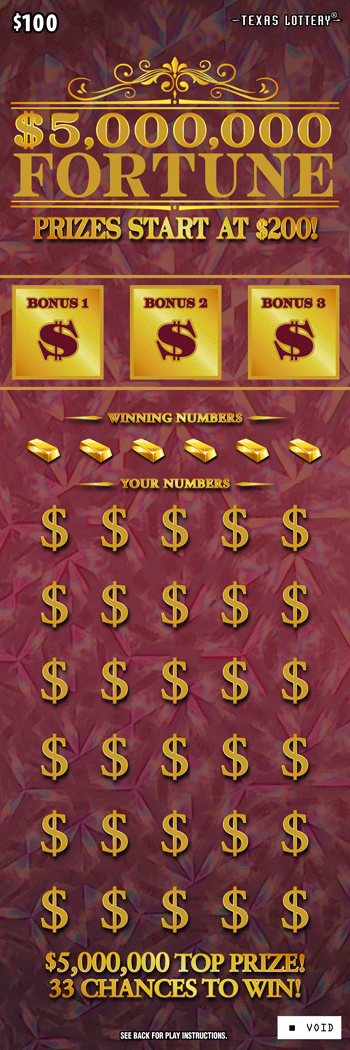
$5,000,000 Fortune
#2665
Buy instead
2× $5 Million Royale $50
+2.2%
-
Instead of
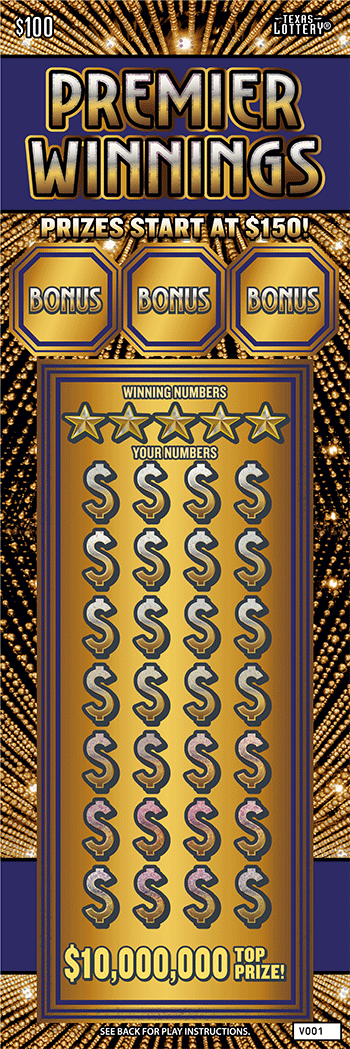
Premier Winnings
#2512
Buy instead
2× $5 Million Royale $50
+2.0%
-
Instead of
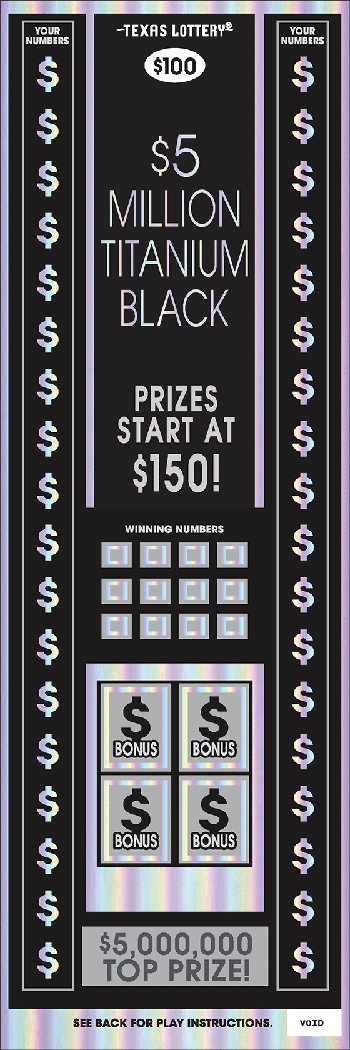
$5 Million Titanium Black
#2627
Buy instead
2× $5 Million Royale $50
+2.0%
Expected value is an average across many tickets, not a prediction for any single purchase, and every one of these games still returns less than it costs on average. Figures are recalculated daily from remaining prizes.
Frequently Asked Questions
What are the best Texas scratch-offs to buy right now?
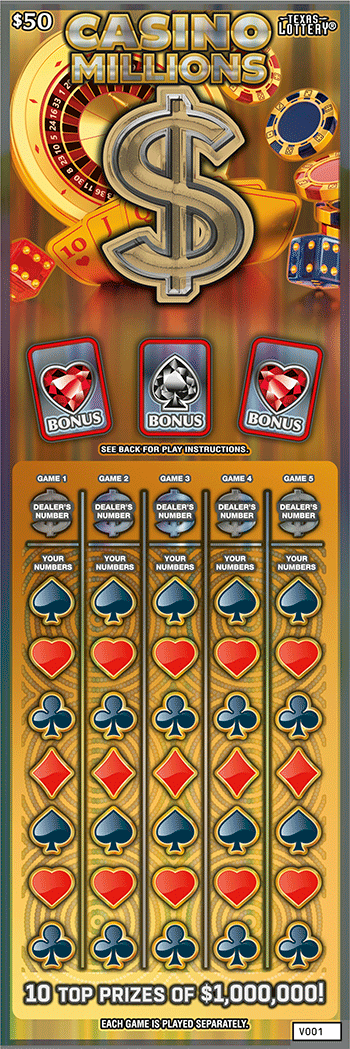
Our three top-graded Texas scratch-offs today are 500X Loteria Spectacular ($50), $5 Million Royale ($50) and Casino Millions ($50). Each still has at least one top prize left. Even these pay back less than they cost on average. Rankings change daily as prizes are claimed.
Which Texas scratch-off is most likely to win?
The Texas game with the best odds of winning any prize is 500X Loteria Spectacular ($50) at 1 in 3.21. It still has 2 top prizes of $3,000,000 left. Most of those wins are small, often just your ticket price back, so good odds are not the same as a good buy.
What's the best Texas scratch-off at each price?
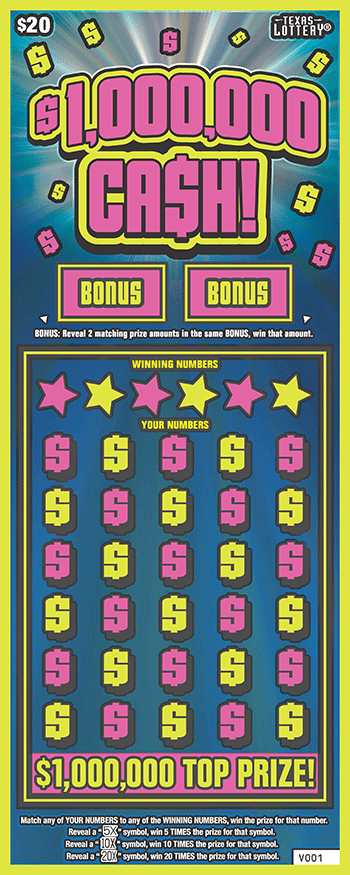
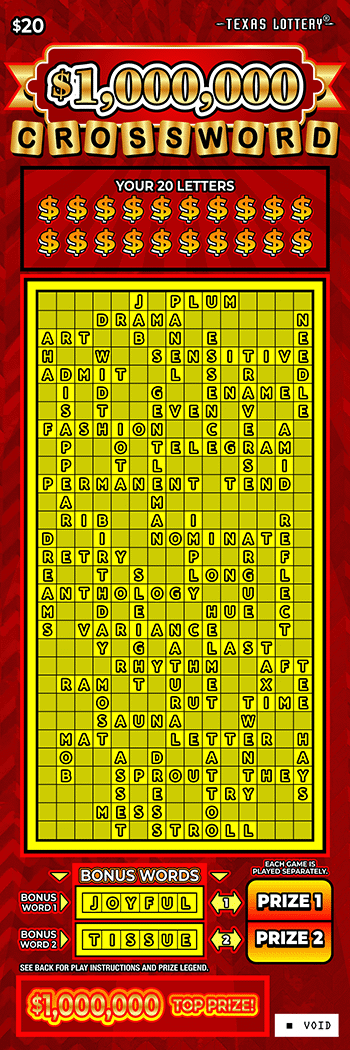
Our top-graded pick at each price today: $1: 3-2-Won!; $2: Patriotic Payout; $3: Cashword; $5: $100,000 Cash; $10: Slots of Luck; $20: $1,000,000 CROSSWORD (#2658); $30: Premier Play; $50: 500X Loteria Spectacular; $100: Premier Winnings. The price filter on this page ranks every game at each price.
Which Texas scratch-offs should I avoid?
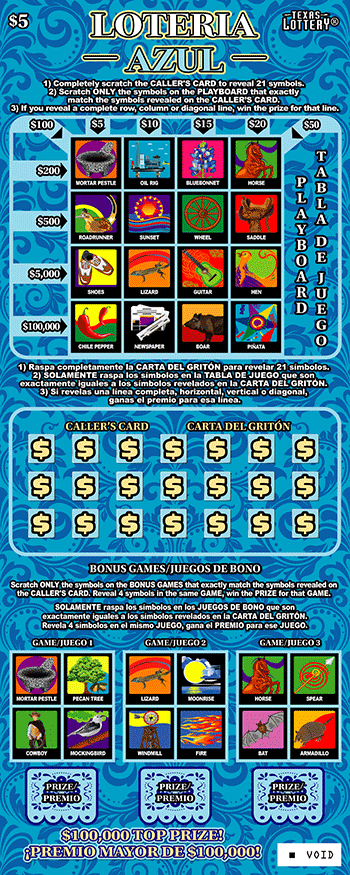
1 Texas game is still on sale even though every top prize has been claimed: Loteria Azul. You pay full price with no chance at the top prize. The Top Prizes Claimed (Avoid) filter on this page lists it.
How do I claim a winning Texas scratch-off?
Prizes up to $599 can be cashed at any lottery retailer in Texas, and prizes up to $2,500,000 at a Texas Lottery claim center. Prizes from $2,500,001 to $5,000,000 can be claimed only at the Austin, Dallas, Fort Worth, Houston and San Antonio claim centers; prizes over $5,000,000 and all prizes paid as annuities must be processed at Texas Lottery headquarters in Austin, by appointment (call 800-375-6886). You can also claim by mail for prizes up to $5,000,000; our guide to where to cash scratch-off tickets covers the forms and ID you need. Federal tax of 24% is withheld on prizes over $5,000, and Texas does not tax lottery winnings (more on taxes on scratch-off winnings).
How long do I have to claim a Texas scratch-off?
You have 180 days from the date the lottery officially ends the game, not from the day you bought the ticket. Check a game's end date before you buy, especially if it is ending soon. Our guide to whether scratch-off tickets expire lists every state's deadline.
Can I buy Texas scratch-offs online or with a card?
Scratch-offs are not sold online in Texas, so you have to buy them in a store. In stores, debit cards are accepted and credit cards are not allowed. You must be 18 or older to buy. More in our guides to buying scratch-offs online and with a debit card.
Do more expensive Texas scratch-offs have better odds?
Mostly, up to $50. The typical (median) game at each price, with its odds of winning any prize and what it pays back per dollar: $1, 1 in 4.68 and about 59 cents; $2, 1 in 4.60 and about 64 cents; $3, 1 in 4.38 and about 64 cents; $5, 1 in 4.14 and about 66 cents; $10, 1 in 3.83 and about 69 cents; $20, 1 in 3.75 and about 75 cents; $30, 1 in 3.55 and about 75 cents; $50, 1 in 3.52 and about 80 cents; $100, 1 in 3.69 and about 80 cents. Payback tends to rise with price, but you still lose money on average at every price.
Are Texas scratch-offs worth it, or do any pay back more than they cost?
Not as an investment. Right now 0 of the 72 Texas games on sale are expected to pay back more than they cost. The best, $5 Million Royale ($50), still returns about 82 cents per dollar, and the typical game about 69 cents. A scratch-off that pays back more than it costs is rare and does not last long, so play for fun with money you can afford to lose. More on whether scratch-off tickets are worth it.
Should I buy Texas games that are ending soon?
Sometimes, when good prizes are still left. The Ending Soon filter on this page lists the Texas games ending within the next 90 days. Bear in mind that scratch-off tickets do expire: in Texas you have 180 days from the date the lottery officially ends the game.
Disclaimer: This information is provided for educational purposes only. All data is sourced from the official Texas lottery website and is updated regularly, but we cannot guarantee 100% accuracy. Lottery games are games of chance, and past performance does not guarantee future results. Please play responsibly and never spend more than you can afford to lose. If you or someone you know has a gambling problem, call 1-800-GAMBLER.

